Following on from our new Quarterly feature about rental prices in Dublin 8, we will also be running a quarterly update for house sales prices in South Dublin City (there is no reliable public data available for Dublin 8 specifically). This is the first installment.
The latest Daft Quarterly Report for house sales in Ireland, for Q3 2013, was released on the 1st of October 2013. This report appeared to suggest that there is a bubble of sorts happening in Dublin City, with house prices on the rise. Daft have assured us that some of this is down to first time buyers who had previously been afraid to enter the market, now all coming to the table at once. They also hone in on the fact that there is not enough building going on across the capital city.
In the report, Ronan Lyons from Daft.ie, suggests another reason for the current rises in Dublin city prices… “It does not take an economist to point out that jobs are scarce currently and what jobs are being created at the moment are being created disproportionately in Ireland’s cities, particularly in Dublin. This is shifting [housing] demand towards the capital”.
He goes on to state that…”Not only has Dublin almost no backlog from the bubble years, it is also building next to no new homes. A city of almost half a million households is building only slightly more than 1,000 units a year. This is probably one tenth of the number of new homes it needs: available figures suggest that there are about 10,000 first-time mothers in Dublin each year”.
Q3 2013 Year-On-Year Property Price Changes:
Overall, the average asking prices for all homes across the Republic of Ireland was down 1.5% year-on-year in Q3 2013, the smallest drop since 2007. Whereas the prices of homes in the rest of the Republic of Ireland fell by 6.7%, the smallest drop since mid-2008, the prices in the capital rose by 7.7% overall, the highest jump since early 2007. In our own part of the city, South Dublin City, the rises are incredible, with home prices up by 8.7% year-on-year, only bettered in Dublin by the City Centre (+9.5%) and the South County (+12.7%).
Q3 2013 Average South Dublin City House Prices:
1 Bed Apartment: €120,000 (+€2,000 / +1.7%)
2 Bed Terraced House: €180,000 (no change)
3 Bed Semi-Detached House: €268,000 (+€3,000 / +1.1%)
4 Bed Bungalow: €428,000 (+€9,000 / +4.6%)
5 Bed Detached House: €552,000 (+€17,000 / +3.2%)
Figures in brackets depict change from Q2 2013
Overall Q3 2013 South Dublin City Average House Sales Prices:
Average home price: €251,228
Quarterly change: +€4,381 / +1.8%
Year-on-year change: +8.7%
Change from peak: -52.9%
The disparity between what is happening in the capital, as opposed to the rest of the country is further highlighted in the report… “For the first time since 2007, each of the six regions of Dublin covered in the Daft.ie Report now shows asking prices rising in year-on-year terms. Every single other region in the country shows them still falling”.
And the report goes on to suggest a solution, to get more affordable homes on the market in urban areas… “Ultimately, housing near centres of employment needs to be affordable. This sounds like a tall order for Government, something perhaps impossible to get right through tinkering with the market”.
This is something which our area is crying out for, housing, and a decent amount of it too, but at affordable prices. We have seen too many proposed developments not going ahead locally, due to the economic situation. You only have to keep an eye on our Weekly Dublin 8 Planning Updates to see them going by the wayside in realtime!
Daft.ie’s Ronan Lyons says that… “for policymakers, a logical place to start addressing this issue is establishing why builders are currently not building”, so is it time for the government to take a proper look at this, and get the building started again?
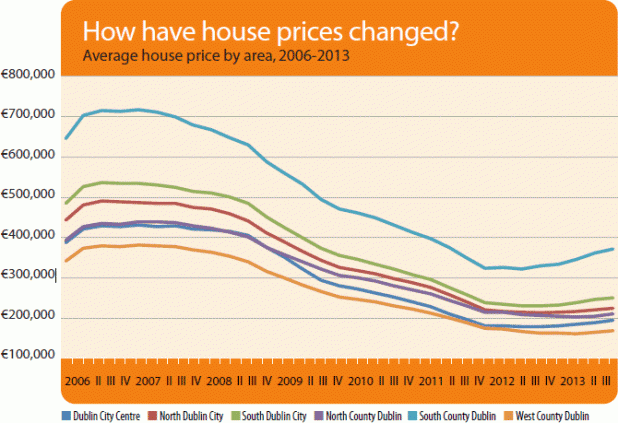
Just to round things off, here is a chart from the report which shows the changes in house sales prices in the six Dublin regions over time. As you can see we are in the second most costly part of Dublin, only behind the South County area, and that’s been the way historically for quite some time. But as you can see clearly from the graph, house prices are on the rise again in our corner of the city.
Please Note: All of the data on this page is taken from the Daft Quarterly Report, by Daft.ie
IMAGE: Clancy Quay Apartments, Islandbridge, Dublin 8 – image credit: Infomatique/Flickr


